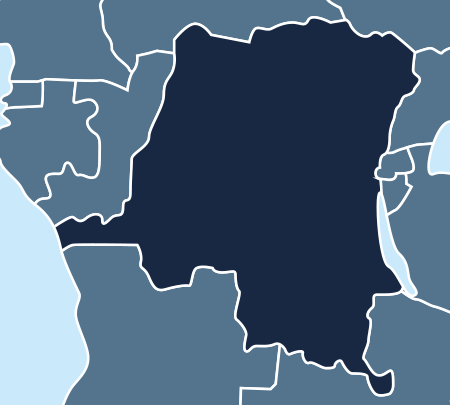
![](https://africaeconomiczones.com/wp-content/uploads/2018/01/DEMOCRATICAL-REPUBLIC-OF-CONGO-.png)
![](https://africaeconomiczones.com/wp-content/themes/afzo/images/capital-city.png)
Kinshasa
Capital city![](https://africaeconomiczones.com/wp-content/themes/afzo/images/economic-city.png)
Kinshasa
Economic City![](https://africaeconomiczones.com/wp-content/themes/afzo/images/population.png)
81 339 988
Population![](https://africaeconomiczones.com/wp-content/themes/afzo/images/surface.png)
2 344 860 kmĀ²
Surface area![](https://africaeconomiczones.com/wp-content/themes/afzo/images/total-gdp.png)
37 642 482 562
Total GDP (USD)![](https://africaeconomiczones.com/wp-content/themes/afzo/images/gdp-growth.png)
3.7 %
GDP Growth (annual %)![](https://africaeconomiczones.com/wp-content/themes/afzo/images/inflation.png)
41.7 %
Inflation, GDP deflator (annual %)![](https://africaeconomiczones.com/wp-content/themes/afzo/images/total-fdi.png)
1 053 658 066
Total FDI (USD)Source: The World Bank
GDP per activity sector
![](https://africaeconomiczones.com/wp-content/themes/afzo/images/agriculture.png)
20 %
Agriculture
(%of GDP)
![](https://africaeconomiczones.com/wp-content/themes/afzo/images/industry.png)
42 %
Industry
(%of GDP)
![](https://africaeconomiczones.com/wp-content/themes/afzo/images/manufacturing.png)
20 %
Manufacturing
(%of GDP)
![](https://africaeconomiczones.com/wp-content/themes/afzo/images/service.png)
34.1 %
Services,value added
(%of GDP)
Source: The World Bank
Foreign Trade Indicators (USD thousand)
8 276 820
Export of Goods
5 010 859
Import of Goods
Source: International Trade Center (ITC)
main exports
![](https://africaeconomiczones.com/wp-content/uploads/2018/02/wire.png)
Copper and articles thereof
![](https://africaeconomiczones.com/wp-content/uploads/2018/01/Icon-precious-or-semi-precious-stones-1-e1555668253357.png)
Other base metals; cermets; articles thereof
![](https://africaeconomiczones.com/wp-content/uploads/2018/01/salt-2.png)
Ores, slag and ash
main clients
![](https://africaeconomiczones.com/wp-content/uploads/2019/04/kOR-FLAG-e1554592093900.png)
Korea
![](https://africaeconomiczones.com/wp-content/uploads/2019/04/thailand-flag.jpg)
Thailand
![](https://africaeconomiczones.com/wp-content/uploads/2019/04/brazil-e1554637673219.png)
Brazil
![](https://africaeconomiczones.com/wp-content/uploads/2019/04/south-africa-e1554583682847.png)
South Africa
![](https://africaeconomiczones.com/wp-content/uploads/2019/04/France-24-X5-2-e1554551950906.png)
France
Source: International Trade Center (ITC)
main imports
![](https://africaeconomiczones.com/wp-content/uploads/2018/02/Objet-dynamique-vectoriel8-3.png)
Machinery, mechanical appliances, nuclear reactors, boilers; parts thereof
![](https://africaeconomiczones.com/wp-content/uploads/2018/01/Pharma-e1555339042622.png)
Pharmaceutical products
![](https://africaeconomiczones.com/wp-content/uploads/2018/01/Objet-dynamique-vectoriel10.png)
Electrical machinery and equipment and parts thereof; sound recorders and reproducers, television
main suppliers
![](https://africaeconomiczones.com/wp-content/uploads/2019/04/south-africa-e1554583682847.png)
South Africa
![](https://africaeconomiczones.com/wp-content/uploads/2019/04/France-24-X5-2-e1554551950906.png)
France
![](https://africaeconomiczones.com/wp-content/uploads/2019/04/japan-flag.jpg)
Japan
![](https://africaeconomiczones.com/wp-content/uploads/2019/04/brazil-e1554637673219.png)
Brazil
![](https://africaeconomiczones.com/wp-content/uploads/2019/04/kOR-FLAG-e1554592093900.png)
Korea
Source: International Trade Center (ITC)