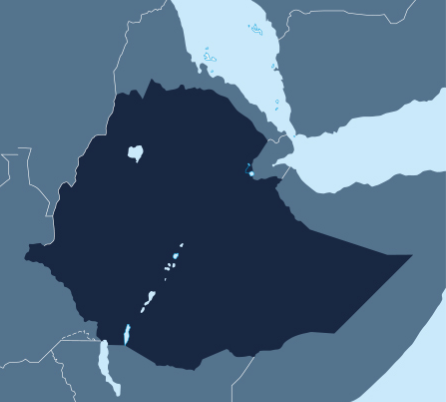
![](https://africaeconomiczones.com/wp-content/uploads/2018/01/Map-Ethiopia.png)
![](https://africaeconomiczones.com/wp-content/themes/afzo/images/capital-city.png)
Addis-Ababa
Capital city![](https://africaeconomiczones.com/wp-content/themes/afzo/images/economic-city.png)
Addis-Ababa
Economic City![](https://africaeconomiczones.com/wp-content/themes/afzo/images/population.png)
104 957 438
Population![](https://africaeconomiczones.com/wp-content/themes/afzo/images/surface.png)
1 104 300 km²
Surface area![](https://africaeconomiczones.com/wp-content/themes/afzo/images/total-gdp.png)
80 561 496 133
Total GDP (USD)![](https://africaeconomiczones.com/wp-content/themes/afzo/images/gdp-growth.png)
10.2 %
GDP Growth (annual %)![](https://africaeconomiczones.com/wp-content/themes/afzo/images/inflation.png)
6.3 %
Inflation, GDP deflator (annual %)![](https://africaeconomiczones.com/wp-content/themes/afzo/images/total-fdi.png)
3 586 400 000
Total FDI (USD)Source: The World Bank
GDP per activity sector
![](https://africaeconomiczones.com/wp-content/themes/afzo/images/agriculture.png)
31 %
Agriculture
(%of GDP)
![](https://africaeconomiczones.com/wp-content/themes/afzo/images/industry.png)
27 %
Industry
(%of GDP)
![](https://africaeconomiczones.com/wp-content/themes/afzo/images/manufacturing.png)
6 %
Manufacturing
(%of GDP)
![](https://africaeconomiczones.com/wp-content/themes/afzo/images/service.png)
36.9 %
Services,value added
(%of GDP)
Source: The World Bank
Foreign Trade Indicators (USD thousand)
2 862 593
Export of Goods
14 692 143
Import of Goods
Source: International Trade Center (ITC)
main exports
![](https://africaeconomiczones.com/wp-content/uploads/2018/01/cofee.png)
Coffee, tea, maté and spices
![](https://africaeconomiczones.com/wp-content/uploads/2018/01/vegetables.png)
Edible vegetables and certain roots and tubers
![](https://africaeconomiczones.com/wp-content/uploads/2018/01/oil.png)
Oil seeds and oleaginous fruits; miscellaneous grains, seeds and fruit; industrial or medicinal
main clients
![](https://africaeconomiczones.com/wp-content/uploads/2019/04/china-flag.jpg)
China
![](https://africaeconomiczones.com/wp-content/uploads/2019/04/somalya-flag.jpg)
somalia
![](https://africaeconomiczones.com/wp-content/uploads/2019/04/usa-flag.jpg)
USA
![](https://africaeconomiczones.com/wp-content/uploads/2019/04/2000px-Flag_of_Saudi_Arabia.svg_-e1554593175137.png)
Saudi Arabia
![](https://africaeconomiczones.com/wp-content/uploads/2019/04/germany-flag.jpg)
Germany
Source: International Trade Center (ITC)
main imports
![](https://africaeconomiczones.com/wp-content/uploads/2018/01/Machinery.png)
Machinery, mechanical appliances, nuclear reactors, boilers, parts thereof
![](https://africaeconomiczones.com/wp-content/uploads/2018/01/Vehicles.png)
Vehicles other than railway or tramway rolling stock, and parts and accessories thereof
![](https://africaeconomiczones.com/wp-content/uploads/2018/01/Electrica.png)
Electrical machinery and equipment and parts thereof, sound recorders and reproducers, television
main suppliers
![](https://africaeconomiczones.com/wp-content/uploads/2019/04/china-flag.jpg)
China
![](https://africaeconomiczones.com/wp-content/uploads/2019/04/usa-flag.jpg)
USA
![](https://africaeconomiczones.com/wp-content/uploads/2019/04/india-flag.jpg)
India
![](https://africaeconomiczones.com/wp-content/uploads/2019/04/japan-flag.jpg)
Japan
![](https://africaeconomiczones.com/wp-content/uploads/2019/04/italy-flag.jpg)
Italy
Source: International Trade Center (ITC)