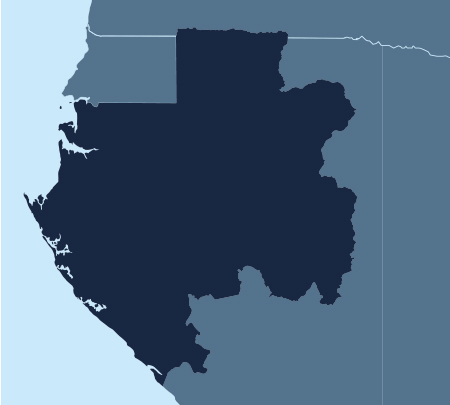
![](https://africaeconomiczones.com/wp-content/uploads/2018/01/Gabon.jpg)
![](https://africaeconomiczones.com/wp-content/themes/afzo/images/capital-city.png)
Libreville
Capital city![](https://africaeconomiczones.com/wp-content/themes/afzo/images/economic-city.png)
Libreville
Economic City![](https://africaeconomiczones.com/wp-content/themes/afzo/images/population.png)
2 119 275
Population![](https://africaeconomiczones.com/wp-content/themes/afzo/images/surface.png)
267 670 Km²
Surface area![](https://africaeconomiczones.com/wp-content/themes/afzo/images/total-gdp.png)
14 622 880 885
Total GDP (USD)![](https://africaeconomiczones.com/wp-content/themes/afzo/images/gdp-growth.png)
1.1 %
GDP Growth (annual %)![](https://africaeconomiczones.com/wp-content/themes/afzo/images/inflation.png)
1,3 %
Inflation, GDP deflator (annual %)![](https://africaeconomiczones.com/wp-content/themes/afzo/images/total-fdi.png)
1 498 038 419
Total FDI (USD)Source: The World Bank
GDP per activity sector
![](https://africaeconomiczones.com/wp-content/themes/afzo/images/agriculture.png)
6 %
Agriculture
(%of GDP)
![](https://africaeconomiczones.com/wp-content/themes/afzo/images/industry.png)
45 %
Industry
(%of GDP)
![](https://africaeconomiczones.com/wp-content/themes/afzo/images/manufacturing.png)
7 %
Manufacturing
(%of GDP)
![](https://africaeconomiczones.com/wp-content/themes/afzo/images/service.png)
43 %
Services,value added
(%of GDP)
Source: The World Bank
Foreign Trade Indicators (USD thousand)
5 364 554
Export of Goods
2 275 578
Import of Goods
Source: International Trade Center (ITC)
main exports
![](https://africaeconomiczones.com/wp-content/uploads/2018/02/fuels-1.png)
Mineral fuels, mineral oils and products of their distillation, bituminous substances, mineral
![](https://africaeconomiczones.com/wp-content/uploads/2018/01/salt.png)
Ores, slag and ash
![](https://africaeconomiczones.com/wp-content/uploads/2018/01/wood-cutting.png)
Wood and articles of wood, wood charcoal
main clients
![](https://africaeconomiczones.com/wp-content/uploads/2019/04/France-24-X5-2-e1554551950906.png)
France
![](https://africaeconomiczones.com/wp-content/uploads/2019/04/Belgium-24-e1554552129841.jpg)
Belgium
![](https://africaeconomiczones.com/wp-content/uploads/2019/04/usa-flag.jpg)
USA
![](https://africaeconomiczones.com/wp-content/uploads/2019/04/italy-flag.jpg)
Italy
![](https://africaeconomiczones.com/wp-content/uploads/2019/04/china-flag.jpg)
China
Source: International Trade Center (ITC)
main imports
![](https://africaeconomiczones.com/wp-content/uploads/2018/01/Objet-dynamique-vectoriel8-1.png)
Machinery, mechanical appliances, nuclear reactors, boilers, parts thereof
![](https://africaeconomiczones.com/wp-content/uploads/2018/02/ships.png)
Ships, boats and floating structures
![](https://africaeconomiczones.com/wp-content/uploads/2018/02/Objet-dynamique-vectoriel10.png)
Electrical machinery and equipment and parts thereof, sound recorders and reproducers, television
main suppliers
![](https://africaeconomiczones.com/wp-content/uploads/2019/04/usa-flag.jpg)
USA
![](https://africaeconomiczones.com/wp-content/uploads/2019/04/china-flag.jpg)
China
![](https://africaeconomiczones.com/wp-content/uploads/2019/04/spain-flag-1-e1554552411209.jpg)
Spain
![](https://africaeconomiczones.com/wp-content/uploads/2019/04/France-24-X5-2-e1554551950906.png)
France
![](https://africaeconomiczones.com/wp-content/uploads/2019/04/malaysia-flag.jpg)
Malaysia
Source: International Trade Center (ITC)