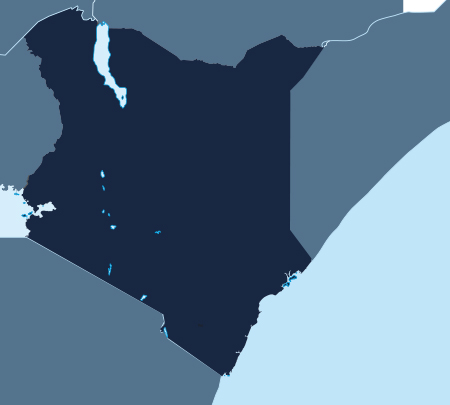
Kenya

Nairobi
Capital city
Nairobi
Economic City
49 699 862
Population
580 370 Km²
Surface area
87 908 262 520
Total GDP (USD)
6.3 %
GDP Growth (annual %)
2.8 %
Inflation, GDP deflator (annual %)
671 488 392
Total FDI (USD)Source: The World Bank
GDP per activity sector

34 %
Agriculture
(%of GDP)

16 %
Industry
(%of GDP)

8 %
Manufacturing
(%of GDP)

42.7 %
Services,value added
(%of GDP)
Source: The World Bank
Foreign Trade Indicators (USD thousand)
6 050 421
Export of Goods
17 376 721
Import of Goods
Source: International Trade Center (ITC)
main exports

Coffee, tea, and spices

Live trees and other plants; bulbs, roots and the like; cut flowers and ornamental foliage

Mineral fuels, mineral oils and products of their distillation, bituminous substances, mineral
main clients

Pakistan

Uganda

USA

Netherlands

United Kingdom
Source: International Trade Center (ITC)
main imports
Mineral fuels, mineral oils and products of their distillation, bituminous substances, mineral

Machinery, mechanical appliances, nuclear reactors, boilers, parts thereof

Electrical machinery and equipment and parts thereof; sound recorders and reproducers, television
main suppliers

China

India

UAE

Saudi Arabia

Japan
Source: International Trade Center (ITC)