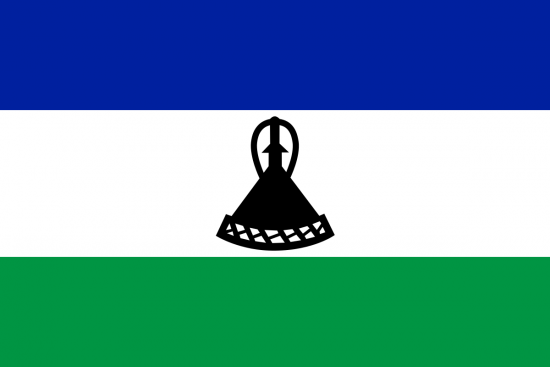

Maseru
Capital city
Maseru
Economic City
2 108 132
Population
30 360 Km²
Surface area
2 791 762 880
Total GDP (USD)
1.5 %
GDP Growth (annual %)
6 %
Inflation, GDP deflator (annual %)
39 585 273
Total FDI (USD)Source: The World Bank
GDP per activity sector

6 %
Agriculture
(%of GDP)

32 %
Industry
(%of GDP)

14 %
Manufacturing
(%of GDP)

52.5 %
Services,value added
(%of GDP)
Source: The World Bank
Foreign Trade Indicators (USD thousand)
1 276 360
Export of Goods
1 531 654
Import of Goods
Source: International Trade Center (ITC)
main exports
Natural or cultured pearls, precious or semi-precious stones, precious metals, metals clad
Articles of apparel and clothing accessories, not knitted or crocheted

Electrical machinery and equipment and parts thereof; sound recorders and reproducers, television
main clients

South Africa

USA

Eswatini

Germany

Canada
Source: International Trade Center (ITC)
main imports

Mineral fuels, mineral oils and products of their distillation; bituminous substances; mineral
Articles of iron or steel
Knitted or crocheted fabrics
main suppliers

South Africa

China

Taiwan

India

Japan
Source: International Trade Center (ITC)

