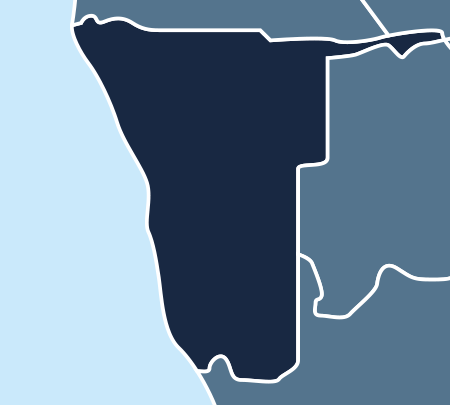
![](https://africaeconomiczones.com/wp-content/uploads/2018/02/Namibia.png)
![](https://africaeconomiczones.com/wp-content/themes/afzo/images/capital-city.png)
Windhoek
Capital city![](https://africaeconomiczones.com/wp-content/themes/afzo/images/economic-city.png)
Windhoek
Economic City![](https://africaeconomiczones.com/wp-content/themes/afzo/images/population.png)
2 448 255
Population![](https://africaeconomiczones.com/wp-content/themes/afzo/images/surface.png)
824 290 Km²
Surface area![](https://africaeconomiczones.com/wp-content/themes/afzo/images/total-gdp.png)
14 521 711 630
Total GDP (USD)![](https://africaeconomiczones.com/wp-content/themes/afzo/images/gdp-growth.png)
-0.1 %
GDP Growth (annual %)![](https://africaeconomiczones.com/wp-content/themes/afzo/images/inflation.png)
6.5 %
Inflation, GDP deflator (annual %)![](https://africaeconomiczones.com/wp-content/themes/afzo/images/total-fdi.png)
219 249 041
Total FDI (USD)Source: The World Bank
GDP per activity sector
![](https://africaeconomiczones.com/wp-content/themes/afzo/images/agriculture.png)
7 %
Agriculture
(%of GDP)
![](https://africaeconomiczones.com/wp-content/themes/afzo/images/industry.png)
29 %
Industry
(%of GDP)
![](https://africaeconomiczones.com/wp-content/themes/afzo/images/manufacturing.png)
10 %
Manufacturing
(%of GDP)
![](https://africaeconomiczones.com/wp-content/themes/afzo/images/service.png)
57.7 %
Services,value added
(%of GDP)
Source: The World Bank
Foreign Trade Indicators (USD thousand)
7 488 296
Export of Goods
8 288 940
Import of Goods
Source: International Trade Center (ITC)
main exports
![](https://africaeconomiczones.com/wp-content/uploads/2018/02/Icon-precious-or-semi-precious-stones-2-e1556872219125.png)
Natural or cultured pearls, precious or semi-precious stones, precious metals, metals clad
![](https://africaeconomiczones.com/wp-content/uploads/2018/02/fish-2.png)
Fish and crustaceans, molluscs and other aquatic invertebrates
![](https://africaeconomiczones.com/wp-content/uploads/2018/02/Ores-e1557397249448.png)
Ores, slag and ash
main clients
![](https://africaeconomiczones.com/wp-content/uploads/2019/04/china-flag.jpg)
China
![](https://africaeconomiczones.com/wp-content/uploads/2019/04/south-africa-e1554583682847.png)
South Africa
![](https://africaeconomiczones.com/wp-content/uploads/2019/04/Belgium-24-e1554552129841.jpg)
Belgium
![](https://africaeconomiczones.com/wp-content/uploads/2019/06/Botswana-flag-e1560606268658.png)
Botswana
![](https://africaeconomiczones.com/wp-content/uploads/2019/04/255px-Flag_of_Great_Britain_1707–1800.svg_-e1554632629335.png)
United Kingdom
Source: International Trade Center (ITC)
main imports
![](https://africaeconomiczones.com/wp-content/uploads/2018/02/fuels-4.png)
Mineral fuels, mineral oils and products of their distillation; bituminous substances; mineral
![](https://africaeconomiczones.com/wp-content/uploads/2018/01/Objet-dynamique-vectoriel9-1.png)
Vehicles other than railway or tramway rolling stock, and parts and accessories thereof
![](https://africaeconomiczones.com/wp-content/uploads/2018/01/Objet-dynamique-vectoriel8-5.png)
Machinery, mechanical appliances, nuclear reactors, boilers; parts thereof
main suppliers
![](https://africaeconomiczones.com/wp-content/uploads/2019/04/south-africa-e1554583682847.png)
South Africa
![](https://africaeconomiczones.com/wp-content/uploads/2019/06/ZAM_lgflag-e1560606597452.gif)
Zambia
![](https://africaeconomiczones.com/wp-content/uploads/2019/04/china-flag.jpg)
China
![](https://africaeconomiczones.com/wp-content/uploads/2019/06/Botswana-flag-e1560606268658.png)
Botswana
![](https://africaeconomiczones.com/wp-content/uploads/2019/06/bulgaria-flag-240-e1560606359152.gif)
Bulgaria
Source: International Trade Center (ITC)