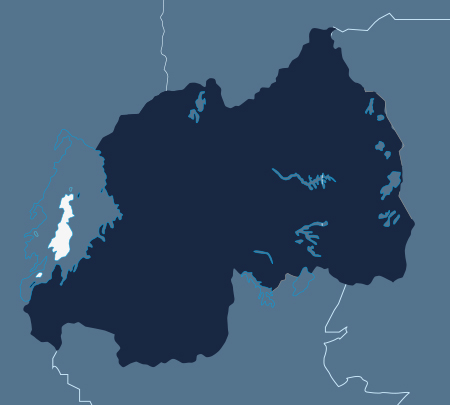
![](https://africaeconomiczones.com/wp-content/uploads/2018/02/Rwanda.jpg)
![](https://africaeconomiczones.com/wp-content/themes/afzo/images/capital-city.png)
Kigali
Capital city![](https://africaeconomiczones.com/wp-content/themes/afzo/images/economic-city.png)
Kigali
Economic City![](https://africaeconomiczones.com/wp-content/themes/afzo/images/population.png)
12 208 407
Population![](https://africaeconomiczones.com/wp-content/themes/afzo/images/surface.png)
26 340 KmĀ²
Surface area![](https://africaeconomiczones.com/wp-content/themes/afzo/images/total-gdp.png)
9 135 454 442
Total GDP (USD)![](https://africaeconomiczones.com/wp-content/themes/afzo/images/gdp-growth.png)
6.1 %
GDP Growth (annual %)![](https://africaeconomiczones.com/wp-content/themes/afzo/images/inflation.png)
7.3 %
Inflation, GDP deflator (annual %)![](https://africaeconomiczones.com/wp-content/themes/afzo/images/total-fdi.png)
239 413 074
Total FDI (USD)Source: The World Bank
GDP per activity sector
![](https://africaeconomiczones.com/wp-content/themes/afzo/images/agriculture.png)
31 %
Agriculture
(%of GDP)
![](https://africaeconomiczones.com/wp-content/themes/afzo/images/industry.png)
16 %
Industry
(%of GDP)
![](https://africaeconomiczones.com/wp-content/themes/afzo/images/manufacturing.png)
6 %
Manufacturing
(%of GDP)
![](https://africaeconomiczones.com/wp-content/themes/afzo/images/service.png)
46.6 %
Services,value added
(%of GDP)
Source: The World Bank
Foreign Trade Indicators (USD thousand)
601 214
Export of Goods
1 306 979
Import of Goods
Source: International Trade Center (ITC)
main exports
![](https://africaeconomiczones.com/wp-content/uploads/2018/02/wire.png)
Natural or cultured pearls, precious or semi-precious stones, precious metals, metals clad
![](https://africaeconomiczones.com/wp-content/uploads/2018/02/Objet-dynamique-vectoriel5-1.png)
Coffee, tea and spices
![](https://africaeconomiczones.com/wp-content/uploads/2018/02/salt.png)
Ores, slag and ash
main clients
![](https://africaeconomiczones.com/wp-content/uploads/2019/04/congo-e1554566283939.png)
Congo DR
![](https://africaeconomiczones.com/wp-content/uploads/2019/04/kenya-flag-e1554566104573.jpg)
Kenya
![](https://africaeconomiczones.com/wp-content/uploads/2019/04/UAE-e1554565998259.jpg)
UAE
![](https://africaeconomiczones.com/wp-content/uploads/2019/04/Switzerland-e1554566061933.gif)
Switzerland
![](https://africaeconomiczones.com/wp-content/uploads/2019/04/burundi-flag1-e1554566142662.jpg)
Burundi
Source: International Trade Center (ITC)
main imports
![](https://africaeconomiczones.com/wp-content/uploads/2018/02/Objet-dynamique-vectoriel10.png)
Electrical machinery and equipment and parts thereof, sound recorders and reproducers, televisionĀ
![](https://africaeconomiczones.com/wp-content/uploads/2018/02/Objet-dynamique-vectoriel8-1.png)
Machinery, mechanical appliances, nuclear reactors, boilers, parts thereof
![](https://africaeconomiczones.com/wp-content/uploads/2018/02/Objet-dynamique-vectoriel9.png)
Vehicles other than railway or tramway rolling stock, and parts and accessories thereof
main suppliers
![](https://africaeconomiczones.com/wp-content/uploads/2019/04/china-flag.jpg)
China
![](https://africaeconomiczones.com/wp-content/uploads/2019/04/255px-Flag_of_Uganda.svg_-e1554565961984.png)
Uganda
![](https://africaeconomiczones.com/wp-content/uploads/2019/04/kenya-flag-e1554566104573.jpg)
Kenya
![](https://africaeconomiczones.com/wp-content/uploads/2019/04/india-flag.jpg)
India
![](https://africaeconomiczones.com/wp-content/uploads/2019/04/UAE-e1554565998259.jpg)
UAE
Source: International Trade Center (ITC)