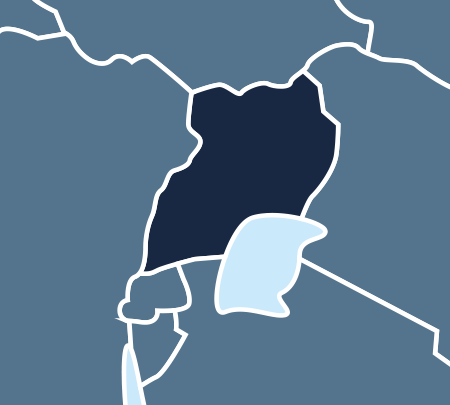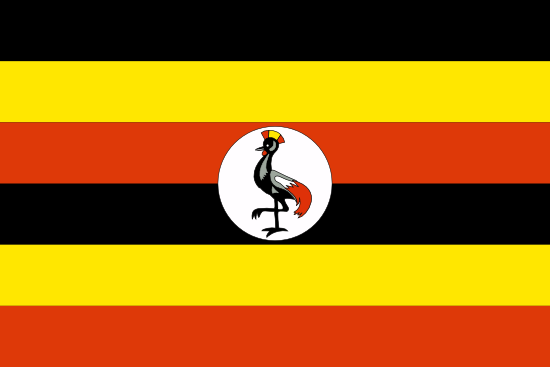

Kampala
Capital city
Kampala
Economic City
42 862 958
Population
241 550 km²
Surface area
27 476 945 526
Total GDP (USD)
6.1 %
GDP Growth (annual %)
3.3 %
Inflation, GDP deflator (annual %)
1 337 128 158
Total FDI (USD)Source: The World Bank
GDP per activity sector

25 %
Agriculture
(%of GDP)

20 %
Industry
(%of GDP)

8 %
Manufacturing
(%of GDP)

47.8 %
Services,value added
(%of GDP)
Source: The World Bank
Foreign Trade Indicators (USD thousand)
3 087 274
Export of Goods
6 729 377
Import of Goods
Source: International Trade Center (ITC)
main exports

Coffee, tea, maté and spices
Natural or cultured pearls, precious or semi-precious stones, precious metals, metals clad

Mineral fuels, mineral oils and products of their distillation; bituminous substances; mineral
main clients

Kenya

UAE

South Sudan

Congo DR

Rwanda
Source: International Trade Center (ITC)
main imports

Mineral fuels, mineral oils and products of their distillation; bituminous substances; mineral

Machinery, mechanical appliances, nuclear reactors, boilers; parts thereof

Vehicles other than railway or tramway rolling stock, and parts and accessories thereof
main suppliers

China

India

UAE

Kenya

Japan
Source: International Trade Center (ITC)

